Dimension-Based Analysis Explained
Dimension-based analysis compares research evidence across user, context, journey, product, and time dimensions to reveal hidden patterns and guide decisions.

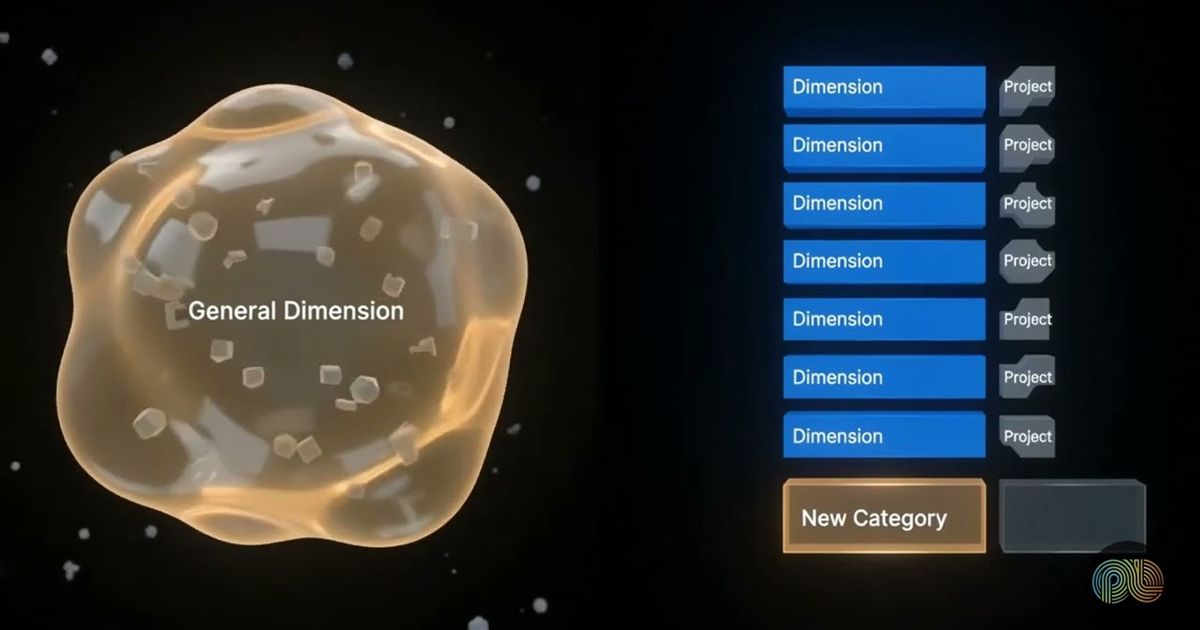
Dimension-based analysis is a research approach that sorts evidence into predefined categories, such as user type, behavior, journey stage, environment, motivation, product area or time period, and then compares patterns inside and between them. It shows what is happening, where and when it happens, and whom it affects.
An average lies by leaving things out. One headline finding can hide real differences in causes, needs and experiences, and then a team makes a decision (or orders more research) that's wider than the evidence allows.
What is dimension-based analysis?
You group research evidence by categories that matter, then compare findings across those groups. Differences and relationships turn up that one big pile of observations would never show you.
So what counts as a dimension? Any perspective that bears on your research objective. The question decides. Customer characteristics, behaviors, needs, motivations, journey stages, environments, usage situations, product areas, time periods: all are candidates.
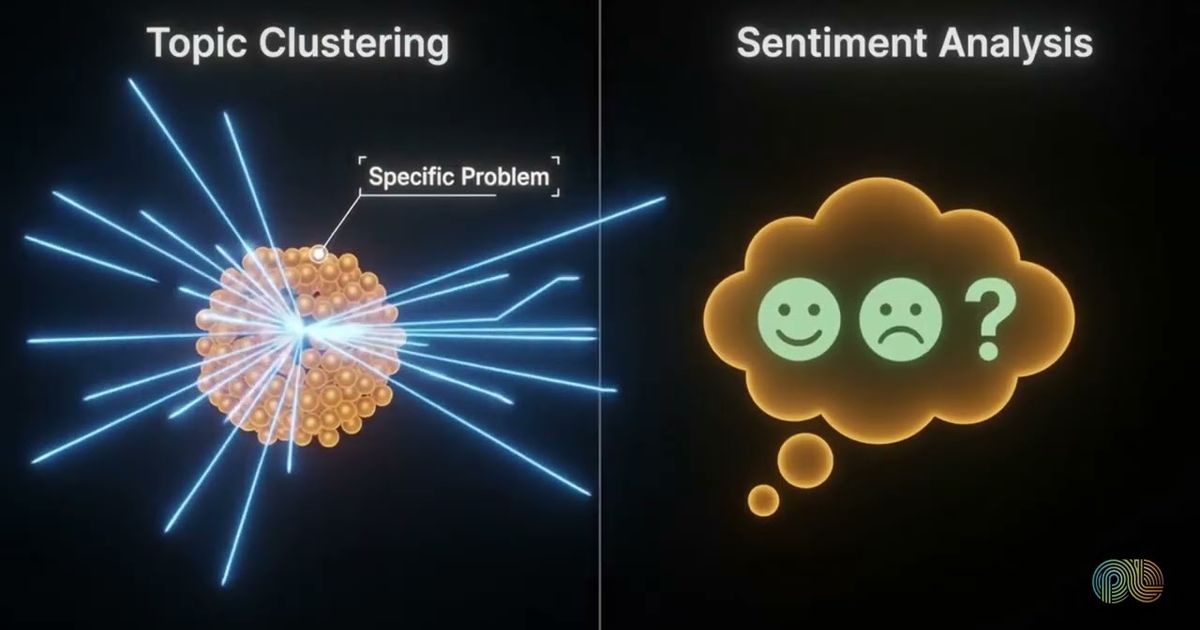
Here's a case. Feedback on a digital service keeps saying people struggle to complete tasks. As one lump, that only names the problem. Split it by experience level, device type and usage situation, and you may learn that different groups fail for different reasons. The dimensions tell you where the pattern lives and who it hurts.
Works inside a single study. Works across several, too, but only with shared definitions and structures. Without them you're comparing categories that merely share a name.
How does dimension-based analysis work?
Start with the objective. The data comes later.
Then four steps:
- Frame the objective. Name the decision the research should inform and the comparisons it needs.
- Define the dimensions. Pick categories tied to the objective, not every attribute you happen to hold.
- Structure the evidence. Use consistent metadata, labels and definitions so filtering and comparing can be trusted.
- Compare and interpret. Hunt for recurring patterns, contrasts, intersections and gaps, then ask whether they explain anything or just raise a new question.
Look at each dimension alone, then at where they cross. A device problem might only bite inexperienced users in one usage environment. But go easy on the crossing. Stack up too many and each cell holds too little evidence to read with any confidence.
AI is handy for this. It can organize large evidence collections, spot patterns across categories and suggest relationships worth checking. We'd keep it in a supporting role, though. A person still has to decide whether the dimensions mean anything, whether the evidence is comparable and whether an apparent link has a credible explanation. It's the same thinking behind using AI as a research assistant instead of a decision maker.

Which dimensions should researchers use?
The ones that mirror your objective and could change how you read a finding. "We have the data" is a poor reason to promote a field into a dimension.
Typical picks:
- User traits, like experience level or role.
- Behaviors: usage patterns, task completion.
- Journey stages.
- Environments and contexts, such as device or usage situation.
- Motivations and needs, which explain why people differ.
- Product areas and time periods.
Define each one and apply it the same way every time. Say one study calls a user experienced because of tenure, and another because of how often they use the product. Merge those groups without saying so and the comparison misleads.
Shared dimensions, metadata and definitions cut down that drift. Teams can compare evidence across studies and skip rebuilding the structure each time. Our guide to designing reusable research dimensions shows how to set that up.
What mistakes should researchers avoid?
Most trace back to weak or inconsistent dimensions. The other big one: treating a relationship an AI suggested as a conclusion before anybody has checked the evidence and structure behind it.
Watch for these:
- Convenient categories. Follow the research question, not the fields a dataset happens to carry.
- Shifting definitions. A category has to mean the same thing wherever it's used.
- Lost context. Keep each coded observation tied to its source, the study conditions and what it originally meant.
- Intersections cut too thin. Too many dimensions leaves comparisons too sparse to interpret.
- Association mistaken for explanation. A pattern across dimensions is something to investigate. It doesn't say why.
- Automated patterns accepted unreviewed. Researchers still weigh relevance, evidence quality and alternative explanations.
Good analysis sits on structured research assets, consistent metadata and reusable frameworks. They keep context attached and make comparisons dependable. Over time an organization stops collecting isolated observations and starts seeing complex behavior as a whole.

How PulseLake helps
PulseLake keeps research objectives, methodology, evidence and decisions in a persistent study context, supported by ontology, governance and lineage. Its research knowledge graph, cross-study search, deep research and qualitative analysis agents help teams organize evidence and examine relationships with provenance intact. To see how this could support reusable dimension-based analysis, talk to our team.
Frequently asked questions
What does dimension mean in research?
It's a perspective or category you use to organize and compare evidence: user type, journey stage, device, time period. You choose it because it could change how a finding is read. Give every dimension a clear definition so it means the same thing wherever you apply it.
How is dimension-based analysis different from thematic analysis?
Thematic analysis looks for recurring ideas or meanings in the evidence. Dimension-based analysis compares evidence across predefined perspectives, like user type, context or journey stage. Use them together: find a theme first, then check how its frequency, form, cause or significance changes across the relevant dimensions.
Can dimension-based analysis combine qualitative and quantitative evidence?
Yes. Qualitative themes, coded observations, survey measures, behavioral indicators and other structured evidence can all be compared across shared dimensions. The evidence types don't need to match. Their definitions, provenance and context do need to stay clear, and each type should be read within its own methodological limits.
How many dimensions should a research project use?
There's no universal number. It depends on the objective, the evidence and the decisions riding on it. Use enough to expose meaningful differences, drop any that don't change the interpretation and favor dimensions with a clear rationale and enough evidence behind them. Explore intersections selectively, when they answer an important question.