Conjoint Analysis Guide: How to Design and Analyze Conjoint Studies (2026)
How to design and analyze conjoint studies: attributes, CBC vs full-profile vs adaptive CBC, sample size, utilities, pricing use and software, with worked examples.
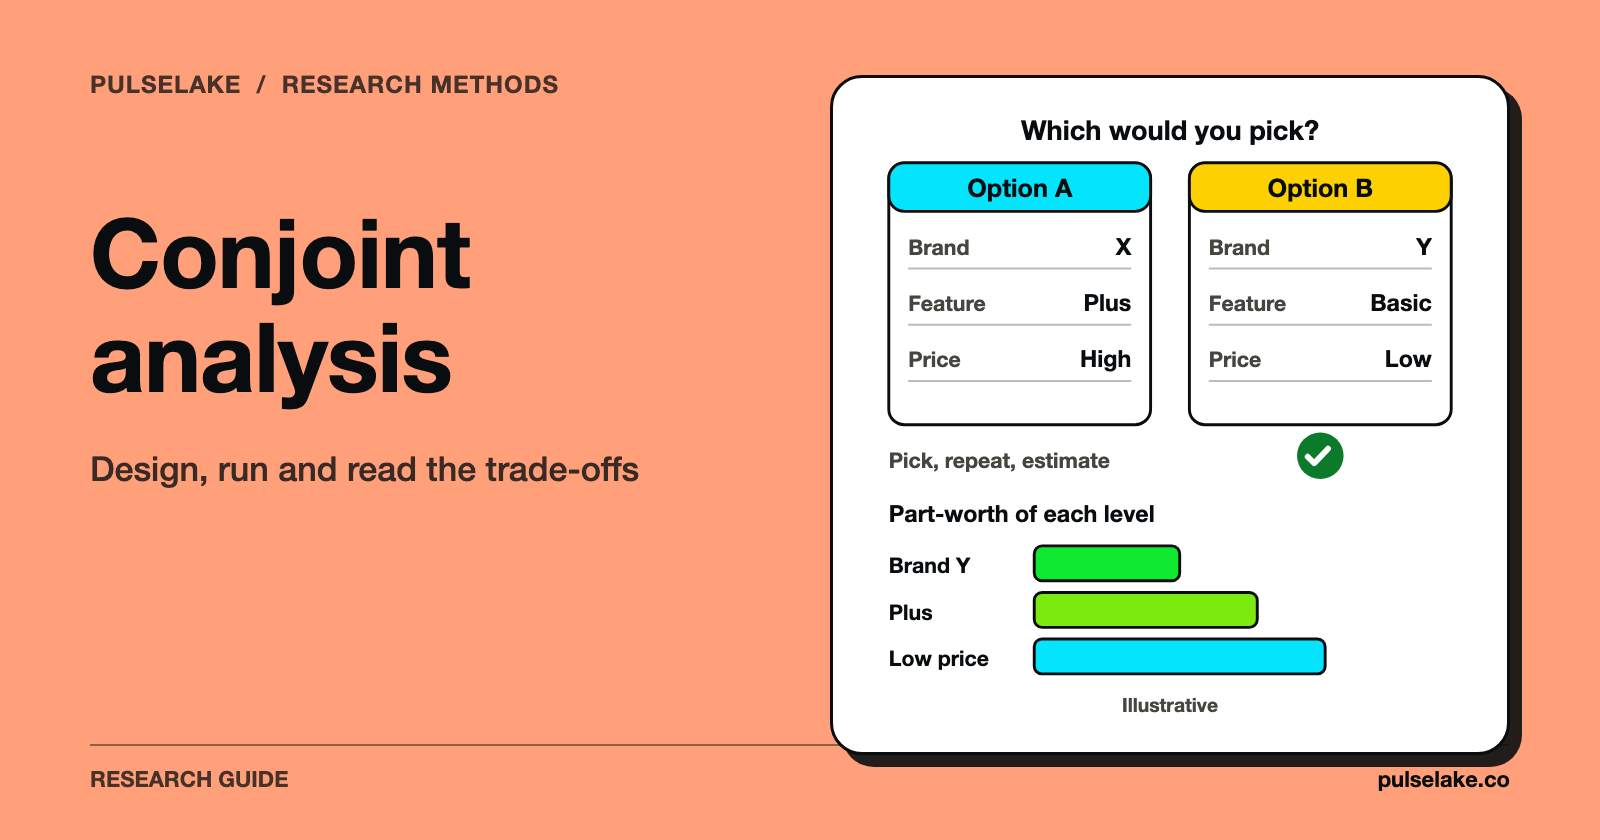
Conjoint analysis is a survey method that estimates how much people value each product feature, price included, by having them choose between or rate realistic product profiles. To run one, you define attributes and levels, pick a design (choice-based conjoint is the usual default; adaptive choice-based suits longer attribute lists), field it to enough respondents, estimate utilities, and test product and price scenarios in a simulator.
We make PulseLake, a research platform. It's mentioned once in this guide, in the software section, and we say plainly where it doesn't apply.

What is conjoint analysis?
Ask customers how important price is and almost everyone says "very." That answer tells you nothing.
Conjoint analysis gets around it. Respondents see products described as bundles of attributes (price, brand, speed, support level), and from their choices or ratings you infer how much each level of each attribute adds to preference. The output is a set of utilities, often called part-worths, one per level. Since people have to trade one attribute against another, you learn what they'll give up to get what they want. A direct "how important is price?" question can't show you that.
Think of this guide as the hub for the topic. For a shorter introduction, see Conjoint Analysis for Better Product Decisions. Our plain-language comparison with a simpler method is in MaxDiff vs conjoint analysis.
What are attributes and levels, and how many should you use?
An attribute is a characteristic of the product, like price, storage or support. A level is one value it can take; for price, that might be $20, $30 or $40 per month. A few rules keep a design honest:
- Levels have to be realistic and mutually exclusive, because a profile can't carry two levels of the same attribute at once.
- Every attribute should be able to move the decision you're making. If a feature can't change what you build or charge, drop it.
- Cover the range you might actually offer. Utilities are estimated only inside the range you test, so don't extrapolate to a price you never showed anyone.
- Keep the list short. Sogolytics notes that traditional full-profile conjoint scales poorly beyond about five or six attributes (Sogolytics), and adaptive designs exist for longer lists (more on those below).
On the pages we reviewed, neither Sawtooth nor Qualtrics gives a fixed maximum attribute count for choice-based studies. So be wary of anyone quoting a universal number, and pilot your design.
What are the types of conjoint analysis?
They differ in what respondents actually do and how the questionnaire gets built. The descriptions below are paraphrased from vendor and guide pages, which aren't neutral methodology references. The "Typical fit" column is our own summary.
| Type | What respondents do | Typical fit |
|---|---|---|
| Full-profile (rating or ranking) | Rate or rank complete profiles | Few attributes |
| Choice-based (CBC) | Pick one profile from a set, or none | Pricing and realistic trade-offs |
| Adaptive choice-based (ACBC) | Screen options, then answer tailored choices | Longer attribute lists |
| Adaptive conjoint (ACA) | Rate items; later questions adapt | Older, rating-based approach |
| Menu-based | Build a package from priced options | Add-on style purchases |
Qualtrics describes choice-based conjoint as the most common form, with respondents picking their preferred concept from sets of 3 to 5 (Qualtrics). Sogolytics describes menu-based conjoint as suited to purchases where customers pick components, such as software add-ons (Sogolytics).
Choice-based vs full-profile conjoint: which should you use?
In full-profile conjoint, respondents rate or rank whole profiles. In choice-based conjoint (CBC), also called discrete-choice conjoint, they choose between profiles, which looks a lot more like a real purchase. Sawtooth says choice data can estimate price sensitivity and willingness to pay, and that CBC avoids the scale-use bias you get with rating questions (Sawtooth Software). Sogolytics adds that rating-based methods are less realistic than choice-based ones for pricing (Sogolytics).
Our view is simple. Use full-profile only when you have few attributes and you genuinely need a rating scale. For nearly any pricing or packaging question, pick CBC.
Discrete choice vs adaptive CBC: what is the difference?
Standard CBC gives every respondent tasks drawn from the same design. Adaptive CBC (ACBC) personalizes the interview instead. Sawtooth's Lighthouse Studio manual describes the ACBC design as sections for build-your-own, a screener and choice tasks, plus an optional calibration section (Sawtooth manual).
Sawtooth is fairly specific about when each one fits:
- ACBC is recommended for studies with "about five or more attributes"; studies with only a few attributes, such as brand, package size and price, are generally better suited to standard CBC (Sawtooth manual).
- Sawtooth says ACBC gives more precise individual-level preferences, tends to predict complex CBC-style holdout tasks better, and is more engaging for respondents. It also typically takes respondents 1.5 to 3 times longer than CBC. That page dates from 2014 and refers to an older software version (Sawtooth knowledge base).
- CBC is still the global standard, so academics and clients may expect it, and it supports designs ACBC can't, such as shelf-display studies (same page).
Bear in mind these claims come from a vendor that sells both methods. Guide sites also define "adaptive" in different ways, so check which design a tool really implements before you buy it.
How do you design a conjoint study step by step?
- Write the decision first. "Which of three plans should we launch, and at what price?" is a design brief, while "learn what customers like" isn't. See defining research problems and objectives.
- List attributes and levels, drawing on interviews, product constraints and competitor offers.
- Choose the method: CBC by default, ACBC if you have about five or more attributes and can afford a longer survey.
- Generate the experimental design. Software builds balanced sets so levels appear evenly and attributes aren't confounded. Avoid prohibitions (combinations that never appear) unless they're truly impossible, because they can distort estimates. Sawtooth notes that if weak options always show up at low prices and strong ones at high prices, the model can learn that people only buy expensive options (Sawtooth knowledge base).
- Write the screen. Show profiles in a consistent layout, and add a "none" option when not buying is a real choice.
- Pilot, then field. Check completion time, straight-lining and whether people can actually read the tasks. Broader survey-writing advice is in survey design best practices.
- Analyze and simulate.
How many tasks per person? Sawtooth says conjoint portions usually include 8 to 20 choice tasks (Sawtooth Software). Conjointly says respondents typically answer 8 to 12 choice questions (Conjointly).
How many respondents do you need?
There's no single formula, and Sawtooth admits as much: its knowledge base calls this "one of the toughest questions in conjoint analysis" (Sawtooth knowledge base). A Sawtooth blog post by Cameron Halversen offers rules of thumb for CBC (Sawtooth blog):
- Start with 300 respondents, and plan for at least 200 in each subgroup you'll report on separately.
- Make sure each attribute level appears at least 500 times across the sample. The author calls 500 the bare minimum in most cases and says planning for 1,000 is safer.
- Simulate random responses to your design and check that standard errors are small enough (below 0.05 for main effects, in the author's guidance).
Here's hypothetical arithmetic for the second rule, using our own count of appearances. Say you have 10 tasks, 3 concepts per task, and a largest attribute with 4 levels. Each respondent sees 10 x 3 = 30 concepts, so any one level of that attribute shows up about 30 / 4 = 7.5 times per respondent. With 300 respondents that's 7.5 x 300 = 2,250 appearances, comfortably above 500. Hitting 500 would take 500 / 7.5, or about 67 respondents.
Don't read that as permission to field 67 people. Sawtooth treats these as rules of thumb, not guarantees (the post notes the 500-appearance and random-response checks were designed for aggregate estimation, so they may not fully reflect Hierarchical Bayes results). And in practice, subgroup reporting usually drives the real number.
How do you analyze conjoint results?
Most choice-based studies are estimated with a logit model, often Hierarchical Bayes (HB), which produces a utility for each level (Sawtooth Software). You'll care about three outputs:
- Utilities (part-worths), where higher means more preferred. Sawtooth notes you can compare them within an attribute but not across attributes.
- Attribute importance. A common convention (our label, not a standard) is each attribute's utility range as a share of the sum of ranges.
- Simulator results. Sawtooth describes the market simulator as the key deliverable, since it lets you test product and price configurations and predict choices.
A hypothetical worked example: a software team tests three attributes, with these made-up utilities.
| Attribute | Level | Utility |
|---|---|---|
| Price per month | $20 / $30 / $40 | 0.8 / 0.0 / -0.8 |
| Automation | None / Basic / Advanced | -0.5 / 0.0 / 0.5 |
| Support | Email / Chat | -0.2 / 0.2 |
The ranges are 1.6 (price), 1.0 (automation) and 0.4 (support), which adds up to 3.0. Importance therefore comes out at about 53%, 33% and 13%. Before you trust any of it, check that price utilities fall as price rises. If they don't, Sawtooth calls this "utility reversal" and lists respondent noise and design prohibitions among the causes.
How is conjoint used for pricing?
Price is just another attribute here. That's what makes conjoint useful for estimating willingness to pay for a feature. Conjointly describes marginal willingness to pay as the amount of money equivalent to moving from a less preferred feature to a more preferred one (Conjointly).
Back to the hypothetical. Price utility falls 0.8 per $10 (0.8 to 0.0), a linear slope of 0.08 per dollar. Upgrading from Basic to Advanced automation adds 0.5, so the implied willingness to pay is 0.5 / 0.08 = $6.25 per month. We assumed a straight line to keep the illustration simple; real analyses read the simulator across the tested prices.
# Illustration only: linear willingness to pay from made-up utilities
price_slope = 0.8 / 10          # utility lost per extra dollar
feature_gain = 0.5              # utility gain, Basic -> Advanced automation
print(feature_gain / price_slope)  # 6.25 dollars per month
Conjointly also says price elasticity can be calculated by choosing two price points on a preference-share simulation. If you want lighter pricing methods, compare Gabor-Granger and Van Westendorp and read Van Westendorp pricing research explained. Conjoint takes more effort, but it tests price and features together, and we think that's usually worth it when a launch is on the line.
Conjoint analysis software: what are the options?
As of October 2026, from each vendor's own public pages:
- Sawtooth Software describes Lighthouse Studio as installed, Windows-based software for developing CBC studies that integrates with web-based survey hosting, and calls the what-if market simulator the key deliverable of a conjoint experiment (Sawtooth Software). Its pages cover CBC, ACBC and HB. Our read: a specialist choice for complex designs.
- Conjointly says its platform automates experimental design for choice sets and that its setup wizard suggests a minimum sample size (Conjointly). Our read: a hosted option where design generation is automated.
- Qualtrics publishes a conjoint guide covering the types above; check with the vendor how conjoint is offered in your plan (Qualtrics).
PulseLake's public pages describe surveys and advanced methods among its research modes, with study context kept in one system. We don't claim a dedicated conjoint design or estimation engine. For a full CBC or ACBC study, use a specialist tool and bring the results into your wider evidence base. We haven't compared pricing and make no ranking.
What are the limits of conjoint analysis?
- Choices are stated, not observed. Nobody is spending real money, so realism depends on clear profiles.
- Attributes are limited, and real products have more features than a survey can show.
- Results hold only within the levels you tested.
- Sampling still matters, because bias in who responds carries into the utilities; see avoiding sampling bias.
- It doesn't replace discovery. If you don't know which attributes matter, start with qualitative work or a concept test, or use MaxDiff without the math to narrow a long list first.
Frequently asked questions
What is conjoint analysis in market research?
It's a survey method that works out the value of each product attribute, price included, from how respondents choose between or rate realistic product profiles. You get a utility for each level. A simulator then turns those into predicted preference for different product configurations.
What is the difference between conjoint and MaxDiff?
MaxDiff ranks one list of standalone items by asking for best and worst picks. Conjoint measures trade-offs between attributes inside whole profiles, price included. Sogolytics notes MaxDiff is closely related but not technically a conjoint method (Sogolytics).
What is the formula for conjoint analysis?
There isn't one formula. Most choice-based studies fit a multinomial logit model, usually with Hierarchical Bayes estimation, where the probability of choosing a profile depends on the sum of its level utilities. The software does the estimation for you.
How many choice tasks should each respondent see?
Somewhere in the 8 to 20 range is usual for conjoint portions, according to Sawtooth, while Conjointly says respondents typically answer 8 to 12 choice questions. Pilot for fatigue, especially when the attribute list is long.
Is conjoint analysis good for pricing?
Yes, as long as price is an attribute with realistic levels. It can show price sensitivity and willingness to pay for features. Just remember the results apply only to the price range you tested.
Can synthetic respondents replace a conjoint sample?
Not for a conjoint that informs a pricing decision, in our view. Synthetic respondents can help you sketch early direction, but the numbers you price on should come from real people. See synthetic respondents and their limits.