Product-Market Fit Survey Guide: Questions, Metrics, and Analysis (2026)
How to run a product-market fit survey: the Sean Ellis question, the Superhuman PMF engine, a question template, sample size and how to analyze results.
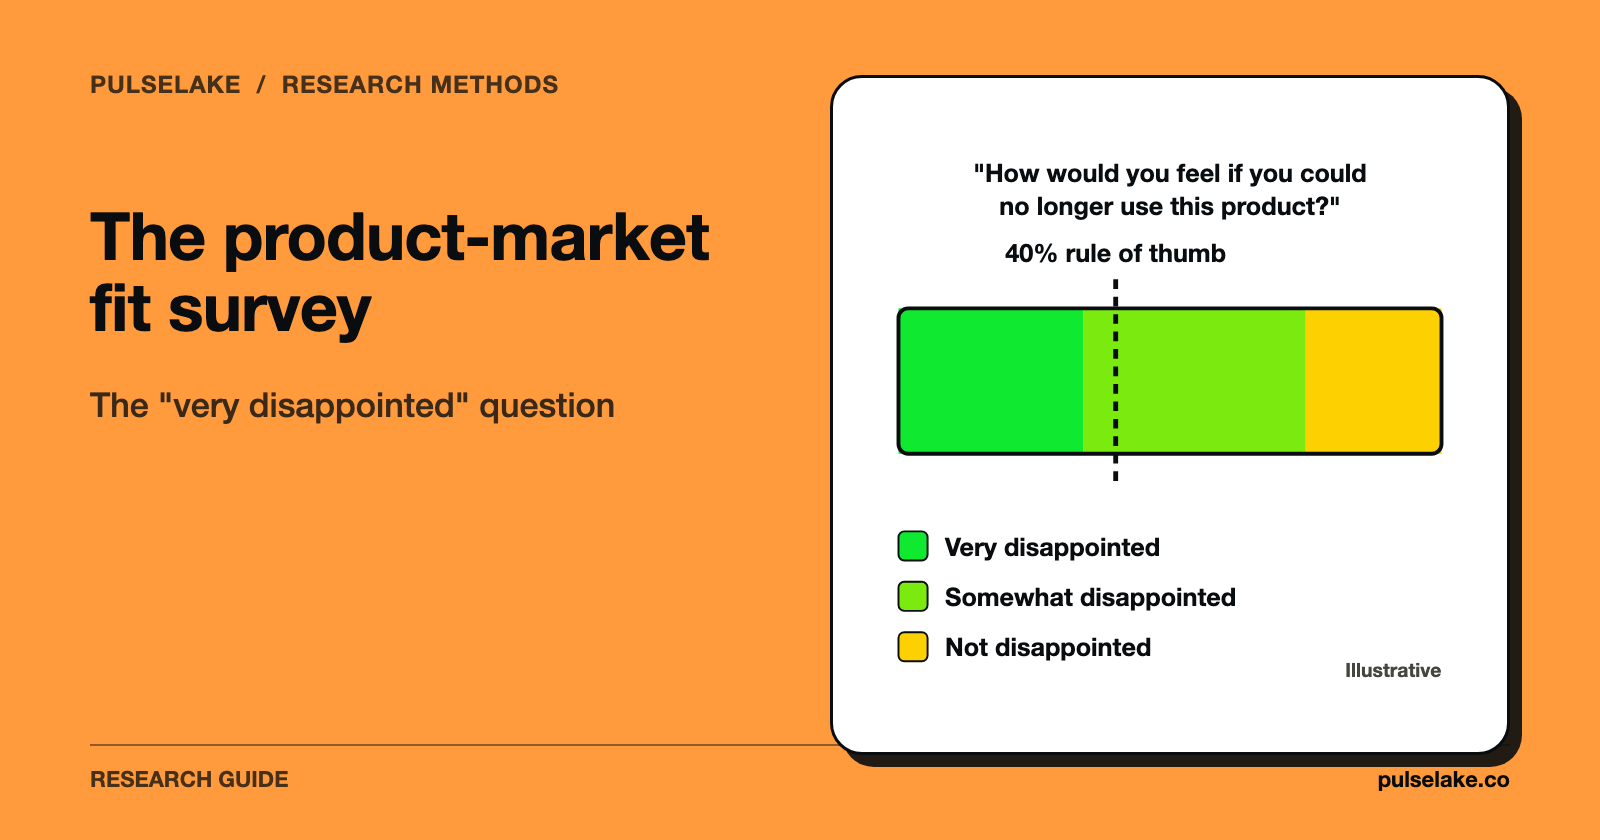
A product-market fit survey asks current, active users how they'd feel if they could no longer use your product. You then divide the "very disappointed" answers by the valid responses. A score of 40% or more is the common rule of thumb for fit. It's a heuristic, not a law, and it only means something if you survey the right people, collect enough responses, and read the score next to retention and usage data.
We make PulseLake, a research platform that supports surveys and other research methods. This guide is method-first and works with any survey tool, free ones included.

What is a product-market fit survey?
A product-market fit (PMF) survey is a short questionnaire for people who already use your product. It turns a vague feeling ("people seem to like it") into a number you can track, plus written answers you can act on.
The idea of fit is older than the survey. Marc Andreessen described product/market fit as being in a good market with a product that can satisfy that market. He described its absence as customers not quite getting value, with slow word of mouth and slow usage growth. The survey is one way to check whether customers really are getting that value.
Three things separate a PMF survey from a general satisfaction survey:
- It asks about dependence ("how would you feel if you could no longer use it?"), not how pleasant the product is.
- It samples users who've experienced the core value, not everyone on your list.
- Its open-ended questions are built to tell you who your best customers are and why they care.
What are the Sean Ellis questions and how is the score calculated?
The core question is: "How would you feel if you could no longer use [product]?" The answer options are:
- Very disappointed
- Somewhat disappointed
- Not disappointed
- N/A, I no longer use it (some versions include this option)
The metric is the percentage who chose "very disappointed." In this guide we drop anyone who chose "no longer use" from the denominator, so the score is:
PMF score = "very disappointed" responses / valid responses (excluding "no longer use") x 100
The question is usually credited to Sean Ellis, who benchmarked nearly 100 startups and found that companies that struggled to grow usually fell below 40% "very disappointed," while those with strong traction usually beat it. That's how Superhuman's founder recounted it in First Round Review, and MeasuringU reports the same history. We didn't open a primary Ellis publication, so treat the benchmark's origin as secondhand.
A worked example with hypothetical numbers: 90 users return the survey, and 10 say they no longer use the product. Of the other 80, 28 are very disappointed, 34 somewhat disappointed and 18 not disappointed. The score is 28 / 80 = 35%. That's under 40%. But those 34 "somewhat disappointed" users are exactly who you should study next.
What is the Superhuman PMF engine and framework?
It's the process Rahul Vohra, Superhuman's founder and CEO, described for turning the "very disappointed" question into a repeatable loop: survey users, segment the answers, decide what to build, measure again. It's a widely cited worked example of the Ellis survey, documented in two primary sources: First Round Review and Superhuman's own blog.
How did Superhuman run the survey?
According to those articles, Superhuman emailed a four-question Typeform survey to users who'd used the product at least twice in the previous two weeks. At the time it had roughly 100 to 200 such users. Each user was surveyed only once, so earlier answers couldn't skew later rounds. The questions were:
- How would you feel if you could no longer use Superhuman? (very, somewhat or not disappointed)
- What type of people do you think would most benefit from Superhuman?
- What is the main benefit you receive from Superhuman?
- How can we improve Superhuman for you?
What did the numbers show?
Superhuman's starting score, in summer 2017, was 22% "very disappointed." Re-scored on the answers of the personas that loved the product most, it rose to 33%. That's a change in who was counted, not in the product. Within three quarters of product work, it reached 58%. These are the company's own reported figures from a small user base, and the Superhuman article doesn't say how many people actually responded.
What did Superhuman do with the answers?
Four moves, and most copycat surveys skip all of them:
- Segment by persona. Responses were grouped by their answer to the first question, and each respondent got a persona. The team focused on the personas in the "very disappointed" group.
- Define the high-expectation customer. Question 2 answers from "very disappointed" users described the people the product was really for.
- Learn what to protect. Question 3 from the same group showed what they valued most (the articles name speed, focus and keyboard shortcuts), so the team knew what not to break.
- Learn what holds others back. Question 4, read only for "somewhat disappointed" users who valued the core benefit, produced the list of blockers. Feedback from "not disappointed" users, and from "somewhat disappointed" users who didn't value the core benefit, was deliberately set aside.
The roadmap was then split roughly 50/50: doubling down on what the loyal group loved, and removing what held the nearly-convinced group back. Items were ranked with a simple low, medium or high estimate of cost and impact.
Where does the Superhuman framework fall short?
The 22% to 58% story is a company's account of itself, not an independent study. The sample was small, it covered only active users, and the "love" half of the roadmap leaned on product judgment. MeasuringU notes it found no peer-reviewed research behind the item and warns against passing or failing a product on the 40% line alone. What's worth copying is the segmentation and the follow-up questions. The exact numbers, less so.
Who should you survey, and how many responses do you need?
People who've experienced the core value: for example, they used the main feature at least twice in the last two weeks. Leave out sign-ups who never activated, one-time users, lapsed users and internal testers. Survey the wrong audience and you can get a high score that doesn't reflect real dependence.
On sample size, First Round Review's account of Superhuman's process treats around 40 respondents as enough for a directional read (First Round Review). Treat 40 to 50 as directional only. MeasuringU's calculation shows why. At 50 responses and a 40% result, the 95% margin of error is about plus or minus 13 points, so the true figure could sit anywhere from about 27% to 53%. At 1,000 responses it narrows to about plus or minus 3 points. Segments hit the same wall at smaller scale. A segment with 15 responses can't support a confident conclusion.
Watch your response rate as well. If only 10% of invited users answer, those people may be your fans, and the score will look rosier than reality.
What other metrics should sit next to the PMF score?
The survey measures stated attachment. Before you make decisions, pair it with behaviour:
- Retention. Do user cohorts keep using the product over time, or does usage drop away after the first weeks?
- Usage depth. Are the "very disappointed" users also your frequent, repeat users?
- Willingness to pay or expansion. Do those same users convert, renew or add seats?
- Referral signals. A likelihood-to-recommend rating or actual referrals show whether users advocate for the product, which isn't the same thing as dependence.
- Alternatives. An open question on what they'd use instead shows how replaceable you are.
If the survey says 45% but retention is sliding, believe the retention data and dig in. If the survey says 30% but one segment sits at 55% and retains well, you may have fit in a smaller market than you thought.
What are good product-market fit survey questions and a template?
Here's a short product-market fit survey template that follows the Ellis and Superhuman pattern, with optional extras:
- How would you feel if you could no longer use [product]? Very disappointed / Somewhat disappointed / Not disappointed / I no longer use it.
- What is the main benefit you get from [product]? (open text)
- What type of person do you think would benefit most from [product]? (open text)
- How could we improve [product] for you? (open text)
- Optional: What would you use if [product] were no longer available? (open text)
- Optional: Your role, team size or use case, so you can segment. (multiple choice)
Keep it to roughly four to six questions. Put the core question first, ask it exactly as written, and skip leading preambles like "We work hard to make a great product." For wording discipline on the open-ended questions, see our guide to writing survey questions that don't bias responses.
How do you run a product-market fit survey step by step?
- Define the audience. Write the activity rule in plain terms (for example, "used the core feature twice in 14 days") and pull the list.
- Add segmentation data. Attach role, plan, company size or acquisition source to each user before sending, so you don't have to ask.
- Send the survey. Email, an in-app prompt or a link all work. Send one reminder to non-responders.
- Score it. Work out the percentage of "very disappointed" among valid responses, with a confidence interval if you can.
- Segment. Recalculate by persona, plan and use case. Look for a group that scores well above the average.
- Read the open text. Code the benefit and improvement answers into themes. With hundreds of answers, see finding themes in thousands of responses.
- Decide. Pick what to protect and what to fix, as in the Superhuman engine.
- Repeat with fresh users. While you're below your target, rerun every few months with users who haven't been surveyed before.
How do you analyze the results?
Start with the overall score. Then spend most of your time on three comparisons.
Very disappointed versus everyone else. What do your most dependent users say the main benefit is? Their words are where positioning and onboarding should start.
Somewhat disappointed with the same benefit, versus without it. Users who value what you do but aren't dependent yet are your best growth opportunity. Their "how can we improve" answers are your blocker list.
Segment versus segment. A blended score averages different groups together. A product can score 28% overall because it scores 60% with one role and 10% with another. Make sure every segment you quote has enough responses to be stable.
For the open-ended answers, write your coding scheme down before you read. Count themes; don't just quote the most vivid response. Keep a link from each theme back to the original answers. If AI helps you code them, spot-check a sample by hand. Our view: the counting, not the scoring, is where a PMF readout is most likely to go wrong.
What mistakes make a PMF survey misleading?
- Surveying everyone. Inactive users dilute the score, and new users haven't experienced the value yet.
- Reading 40% as a pass mark. It's a benchmark from one practitioner's sample, not a validated threshold.
- Chasing the indifferent. Building for the "not disappointed" group can wear away what the loyal group loved.
- Over-reading small samples. A five-point change on 40 responses is within the noise.
- Surveying the same people again and again. Earlier answers can bias later ones.
- Ignoring non-response. The people who answer aren't a random slice of your users.
Where does PulseLake fit?
PulseLake supports traditional research, including surveys, along with AI-led interviews with real participants and a calculation mode that computes answers against study data instead of generating them. For a PMF programme, that might mean running the survey and then interviewing "very disappointed" and "somewhat disappointed" users, with the study context and evidence kept in one place. You don't need it to run this survey, though. A form tool and a spreadsheet are enough to start.
Frequently asked questions
What is a good product-market fit score?
The usual benchmark is 40% or more "very disappointed." Treat that 40% as a rule of thumb, not a validated cutoff: use the score to prioritise work, and check it against retention.
How many responses do I need for a PMF survey?
Around 40 to 50 gets you a directional read, and 100 or more is better. At 50 responses, the margin of error on a 40% score is about 13 points either way, so only large differences or changes mean much.
Who should I send the product-market fit survey to?
Current users who've experienced the core value, such as people who used the main feature at least twice in the past two weeks. Leave out non-activated sign-ups, lapsed users and internal testers.
How often should I run a PMF survey?
While you're working toward fit, every few months or after major releases is reasonable, with fresh users each time. Once you have fit, periodic checks (quarterly or annually, say) show whether it holds as you reach less enthusiastic users.
What did Superhuman's PMF score start at?
By Superhuman's own account, 22% "very disappointed" in summer 2017. It rose to 33% when re-scored on its best-fit personas, then to 58% within three quarters of product changes. These are company-reported figures.
Can I run a product-market fit survey before launch?
Not in its standard form, because the core question assumes people have used the product. Beta testers can answer a modified version before launch, but their scores aren't comparable to the 40% benchmark.