Market Sizing Guide: How to Calculate TAM, SAM, and SOM in 2026
How to calculate TAM, SAM and SOM step by step, with a hypothetical worked example, top-down vs bottom-up, common mistakes and where to find data.
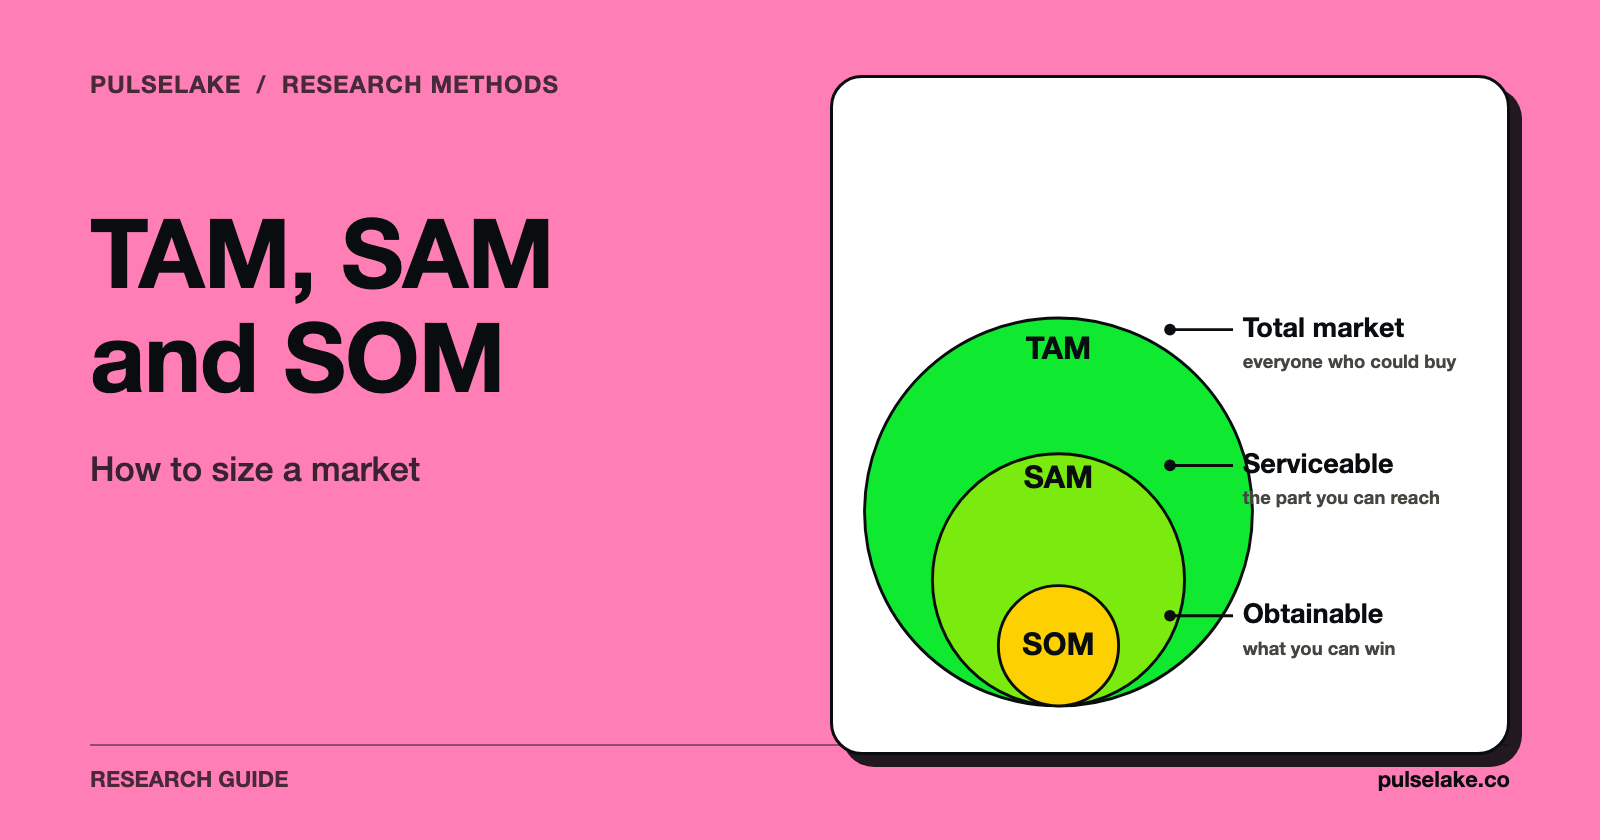
To calculate TAM, SAM and SOM, you estimate three nested numbers. TAM (total addressable market) is the revenue if every possible buyer bought. SAM is the slice of TAM your product, price, channels and geography can actually serve. SOM is the slice of SAM you can realistically win in a set period. The usual arithmetic: customers times annual revenue per customer for TAM, then a serviceable percentage for SAM and an obtainable percentage for SOM.
We make PulseLake, a research platform. It comes up once in this guide, in the section on testing assumptions.

What are TAM, SAM, and SOM?
Think of them as layers, each one sitting inside the one above it.
- TAM is the full revenue opportunity if every potential buyer purchased from you. It's a ceiling, not a forecast (HG Insights).
- SAM is the share of TAM you can serve given your business model, pricing, channels and geography. The S in SAM is usually written "serviceable addressable" (HG Insights); some guides say "serviceable available", and they mean the same thing.
- SOM is the share of SAM you can realistically win within a stated time frame, given competition and resources such as sales capacity (Salesforce).
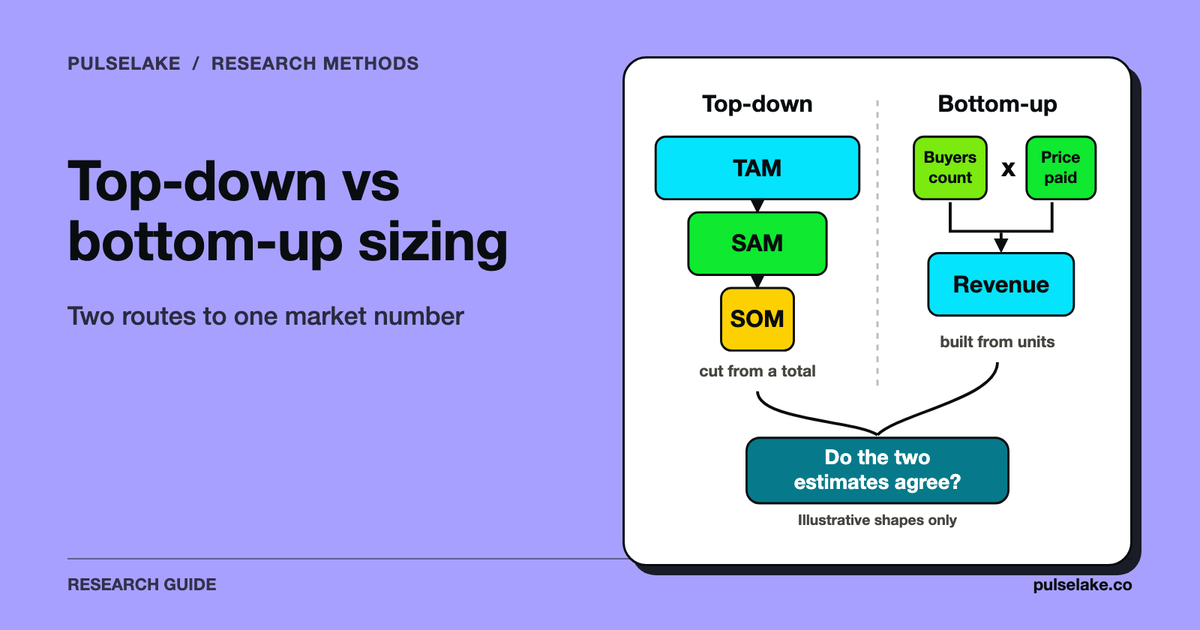
Wall Street Prep writes TAM as the number of customers x annual contract value (ACV), then applies a serviceable percentage and an obtainable percentage to get to SAM and SOM (Wall Street Prep).
How do you calculate market size step by step?
- Define the product and the buyer. One sentence: who pays, for what, how often. Fuzzy definitions are the main reason two people come up with two different TAMs. See defining research problems and objectives.
- Pick a unit of count. Companies, clinics, households, seats or transactions. Use the unit the buyer actually buys.
- Count the units. Public statistics, industry reports or your own lists all work.
- Set revenue per unit per year. That's price multiplied by how often it's bought. People forget the frequency part all the time.
- Multiply to get TAM.
- Apply filters for SAM. Geography, company size, segment, compatibility, the channels you can reach.
- Apply a win share for SOM. Base it on sales capacity and the competition, and give it a time frame.
- Write down every assumption, and mark which ones are sourced and which are guesses.
How do you do market sizing with a real example?
This example is hypothetical. The product, the country and every number in it are invented to show the arithmetic. None of it is market data.
The scenario: a startup sells appointment-scheduling software to independent veterinary clinics in one (fictional) country.
| Step | Assumption (hypothetical) | Arithmetic | Result |
|---|---|---|---|
| Clinics in the country | 20,000 | ||
| Price per clinic per year | $2,400 | ||
| TAM | 20,000 x $2,400 | $48,000,000 | |
| Clinics with 2+ vets | 40% of clinics | ||
| Clinics in launch regions | 50% of clinics | ||
| Serviceable clinics | 20,000 x 0.40 x 0.50 | 4,000 clinics | |
| SAM | 4,000 x $2,400 | $9,600,000 | |
| Share won in 3 years | 5% of serviceable clinics | 4,000 x 0.05 | 200 clinics |
| SOM | 200 x $2,400 | $480,000 |
Two things jump out. First, TAM is five times SAM here (48 / 9.6 = 5). Quote TAM as "the opportunity" and you've overstated it by 400%. Second, SOM is a plan, not a guess. Two hundred clinics in three years is roughly 67 a year, about 5.6 a month, and you can hold that up against how many deals your sales team can actually close.
Now test the sensitivity. At a 3% win share, SOM is 4,000 x 0.03 = 120 clinics x $2,400 = $288,000. At 8%, it's 4,000 x 0.08 = 320 clinics x $2,400 = $768,000. The win share swings the answer far more than rounding the clinic count ever will. That's the assumption we'd research first.
What is the difference between top-down and bottom-up market sizing?
Top-down starts from an outside figure for the whole market, usually an industry report, and narrows it with percentages. It's quick and suits a new product with little sales data, but it's only as good as its source (Salesforce). Bottom-up builds from unit counts and prices, like the example above. It takes longer. It's also easier to defend, because anyone can inspect each input. Most careful sizing does both and compares the results.
Sticking with the hypothetical, say an invented industry report claims clinics spend $400 million a year on practice software, and scheduling is 15% of that:
- Top-down TAM = $400,000,000 x 0.15 = $60,000,000
- Top-down SAM = $60,000,000 x 0.20 (the same 40% x 50% filter) = $12,000,000
- Top-down SOM = $12,000,000 x 0.05 = $600,000
The bottom-up TAM ($48M) is 80% of the top-down TAM ($60M). Flip it around and top-down is 25% higher (60 / 48 = 1.25). That gap is a reason to dig, not a failure. Maybe the report counts clinics you can't sell to. Maybe your price sits below the average clinic's scheduling spend. If the two methods land in the same order of magnitude and you can explain the difference, your number is more credible than either one alone.
What are the common market sizing mistakes?
- Treating TAM as the target. Not every possible buyer is going to buy.
- Filtering SAM on size alone. Two firms of the same size and sector can differ in technology maturity and spend (HG Insights).
- Using one win rate for everything. Competition varies by segment, so estimate SOM segment by segment.
- Arithmetic slips. Long chains of percentages are easy to get wrong. Recompute every worked example you copy, including ours, and keep each step on its own line.
- Doing it once and forgetting it. Revisit the numbers when you launch a product, enter a new market or change strategy (Salesforce).
Which market sizing tools and frameworks help?
No tool replaces the logic above, because every tool still needs your assumptions. What they give you is inputs. The list below is by role, not a ranking, and reflects what each provider says on its own site as of October 2026.
| Tool or source | Best for | What its own page says (as of October 2026) |
|---|---|---|
| Statista | Quick top-down figures across many industries and countries | Says its Market Insights cover 190+ countries, territories and regions, and also offers a statistics database and forecasts. |
| IBISWorld | Industry-level reports with outlooks for a top-down start | Says it provides data and insights on thousands of industries, including market sizing data and five-year forecasts. |
| US Census Bureau County Business Patterns | Free bottom-up counts of businesses by industry and employment size in the US | Provides establishments with paid employees by industry and employment size, with employment and payroll data. |
| A spreadsheet | Bottom-up models, sensitivity cases and showing your assumptions | Any spreadsheet works; put each assumption in its own labelled cell. |
Statista and IBISWorld are commercial providers, so they suit teams that need breadth fast. The Census data is the better pick when you need US business counts and don't mind doing the filtering yourself. Outside the US, look for your national statistics office. You'll also find free online TAM/SAM/SOM calculators. They do the multiplication, not the research, so their output is only as good as what you type in.
How do you test the assumptions behind your estimate?
The shakiest inputs are usually price, the share of buyers who need the product, and the win rate. You can test all three with primary research. A survey of target buyers can estimate how many would consider the product, and at what price. PulseLake supports survey-based research, and its articles on avoiding sampling bias and Van Westendorp pricing research walk through the method. Use sources with relevant market coverage and transparent definitions for the top-down estimate; keep the source dates and assumptions with the calculation.
Frequently asked questions
What is the difference between TAM, SAM, and SOM?
TAM is everyone who could buy, SAM is the part you can serve, and SOM is the part you can realistically win in a set period. Each one is a subset of the one before.
How do you calculate TAM?
Multiply the number of potential customers by annual revenue per customer. In the hypothetical example that's 20,000 clinics x $2,400 = $48,000,000. The top-down route starts from a published market figure and multiplies by the share that's relevant to your product.
Is top-down or bottom-up market sizing better?
It depends, and neither wins every time. Top-down is faster, while bottom-up is easier to defend because you can see the inputs. Do both and explain the gap.
What is a good SOM percentage?
Nobody can give you a universal figure. One vendor guide suggests roughly 5-15% of SAM for early-stage B2B and says anything above about 20% needs strong evidence (HG Insights). Work yours out from sales capacity and competition, then test a low case and a high case.
How often should you update your market size?
Whenever you launch products, enter new markets or change strategy. Also any time a key input, such as price, moves.
Do I need paid tools to size a market?
You don't. Public statistics such as Census data and a spreadsheet are enough for a bottom-up estimate. Paid reports just save time on the top-down figures.