Top-Down vs Bottom-Up Market Sizing: Formulas and TAM SAM SOM Guide
Top-down vs bottom-up market sizing: formulas for TAM, SAM and SOM, a hypothetical worked example using both methods, and how to reconcile the gap.
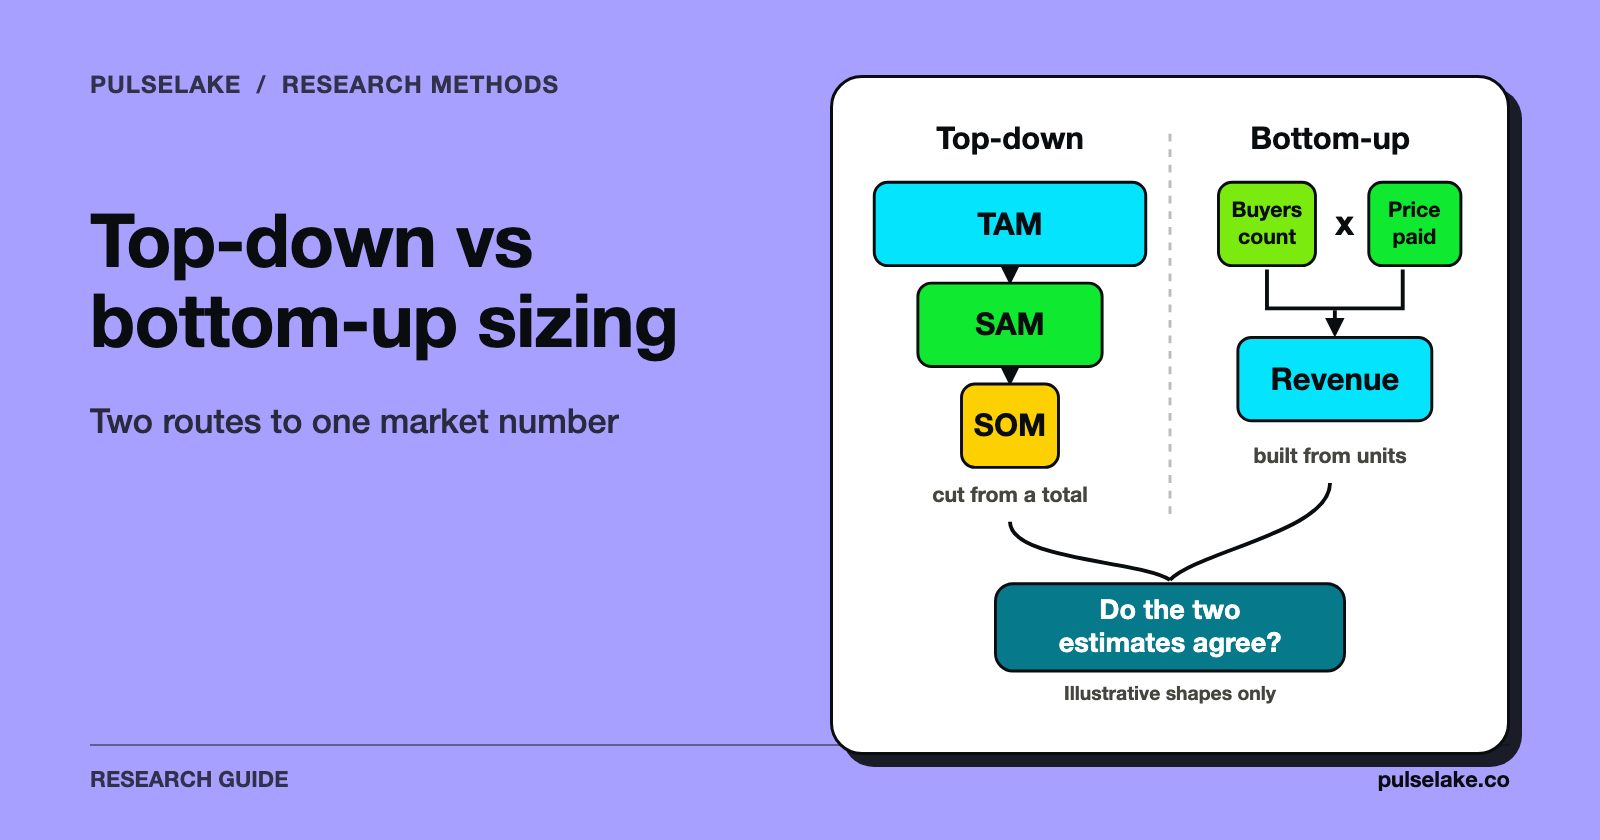
Top-down market sizing starts with an outside figure for a whole market, such as an industry report, and narrows it with percentages until you reach the part you can serve. Bottom-up sizing starts with units you can count (customers, seats, transactions) and a price, then multiplies upward. Top-down is faster. Bottom-up is easier to defend, and the sturdiest estimates run both and explain the gap.
We make PulseLake, a research platform. It comes up once, in the section on testing assumptions.
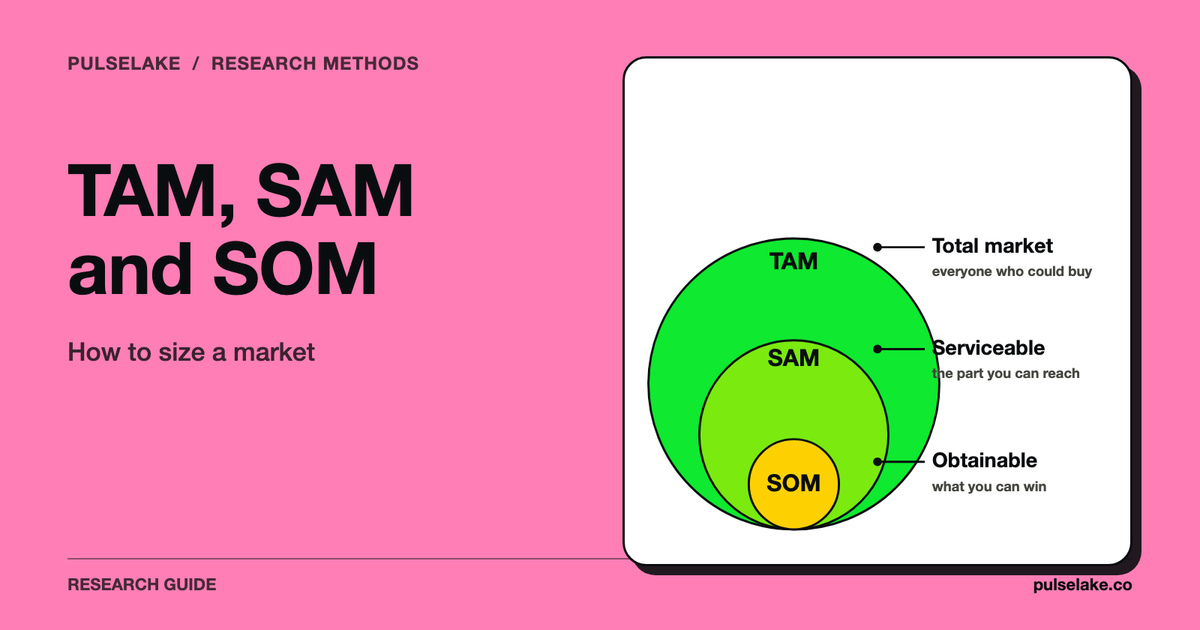
This guide is about picking between the two methods and writing out the formulas for each. If you want definitions of TAM, SAM and SOM and a first worked example, start with our market sizing guide. The example here is a different one.

What is the difference between top-down and bottom-up market sizing?
| Top-down | Bottom-up | |
|---|---|---|
| Starting point | A published market total | Units you can count, times a price |
| Typical inputs | Industry reports, analyst data, government statistics | Customer lists, price, sales data, business counts |
| Speed | Fast | Slower |
| Main risk | Inherits the errors of the source | Assumptions stacked on assumptions |
| Best when | The product is new and you have little data | You can count buyers and know your price |
Salesforce describes the top-down approach as drawing mostly on external sources and narrowing with assumptions. It says this suits new products with little sales or customer data, and that it's only as accurate as the data available. Bottom-up, in its description, starts from your own sales data and customer insights and scales up; Salesforce says this tends to be more accurate but takes more time (Salesforce).
Wall Street Prep frames the choice by company stage. It describes market sizing as a top-down method that can be used across the company lifecycle and is most applicable to early- to growth-stage companies, and it says the bottom-up method is more appropriate for established, mature companies. Its shorthand for the bottom-up weakness is "garbage in, garbage out": the quality rests on the assumptions behind the forecast (Wall Street Prep).
What are the top-down market sizing formulas?
The usual top-down chain runs from a market total down to SAM and SOM using percentages:
- Top-down TAM = reported market spend x share relevant to your product
- SAM = TAM x percentage you can serve
- SOM = SAM x percentage you can obtain
Wall Street Prep's SaaS version computes TAM as total customers x annual contract value (ACV), with ACV equal to total contract value divided by contract length, then SAM = TAM x % serviceable and SOM = SAM x % obtainable (Wall Street Prep). The SAM and SOM percentages on that page illustrate its example. They aren't benchmarks.
Percentage filters have a quiet flaw. They assume the filtered share of buyers spends the same as everyone else. If the buyers you can actually reach are smaller than average, a top-down SAM will overstate your market.
What are the bottom-up market sizing formulas?
Bottom-up runs the other way:
- Bottom-up TAM = number of potential buyers x revenue per buyer per year
- SAM = number of buyers you can reach and serve x revenue per buyer
- SOM = deals your team can close in the period x revenue per buyer
That SOM step is where the two methods really part ways. You don't have to apply a share to SAM. You can derive SOM from capacity instead: how many salespeople you have, how many deals each can close, and over what period. Salesforce's bottom-up example works like this, estimating how many new customers a sales team can realistically win each year (Salesforce).
How do TAM and SAM calculation models compare in a worked example?
Everything below is hypothetical. The product, the country and every number are invented to show the arithmetic. None of it is market data.
The scenario: a startup sells fleet-maintenance software to small trucking firms in one fictional country. Those firms keep their service records in spreadsheets or on paper.
Bottom-up model (hypothetical)
| Step | Assumption | Arithmetic | Result |
|---|---|---|---|
| Firms with 5 to 50 trucks | 30,000 | ||
| Average trucks per firm | 15 | ||
| Price per truck per year | $144 ($12 x 12 months) | ||
| Revenue per firm per year | 15 x $144 | $2,160 | |
| TAM | 30,000 x $2,160 | $64,800,000 | |
| Firms in launch regions | 40% | ||
| Firms still on spreadsheets or paper | 60% | ||
| Serviceable firms | 30,000 x 0.40 x 0.60 | 7,200 firms | |
| SAM | 7,200 x $2,160 | $15,552,000 | |
| Sales capacity | 2 reps x 4 deals a month | 2 x 4 = 8 a month | |
| Deals in 3 years | 8 x 36 | 288 firms | |
| SOM | 288 x $2,160 | $622,080 |
The SOM works out to 288 / 7,200 = 4% of serviceable firms. Notice that the percentage comes out of the capacity assumption. Nobody typed it in.
Top-down model (hypothetical)
Now suppose an invented industry report says small trucking firms spend $1.2 billion a year on operational software, and fleet maintenance is 6% of that.
- Top-down TAM = $1,200,000,000 x 0.06 = $72,000,000
- Top-down SAM = $72,000,000 x 0.24 (the same 40% x 60% filter) = $17,280,000
- Top-down SOM = $17,280,000 x 0.04 = $691,200
Comparing the two
| Bottom-up | Top-down | |
|---|---|---|
| TAM | $64,800,000 | $72,000,000 |
| SAM | $15,552,000 | $17,280,000 |
| SOM | $622,080 | $691,200 |
The top-down TAM is $7,200,000 higher (72.0 - 64.8), so the bottom-up TAM is 90% of it (64.8 / 72.0 = 0.9). Same order of magnitude, which is reassuring. The gap is still worth a question, though. Maybe the report counts firms outside your 5 to 50 truck band. Maybe the $12 price sits below what firms really spend. If you can name the reason, you can reconcile the numbers, and if you can't, the discrepancy tells you which input to research next.
What market sizing template should you use?
A spreadsheet does the job. Keep one row per input, and give each one a label, a value, a source and a confidence note:
| Input | Value | Source | Sourced or guess |
|---|---|---|---|
| Firms in segment | 30,000 | Business census or list (hypothetical) | Sourced |
| Revenue per firm | $2,160 | Price x units | Calculated |
| Launch-region share | 40% | Your plan | Guess |
| Deals per rep per month | 4 | Pilot data | Guess |
Here's the same logic in code, purely as an illustration (the numbers are the hypothetical ones above):
# Illustration: bottom-up sizing with the hypothetical inputs above
firms = 30_000
revenue_per_firm = 15 * 12 * 12          # trucks x price per month x months
tam = firms * revenue_per_firm
serviceable_firms = firms * 0.40 * 0.60
sam = serviceable_firms * revenue_per_firm
som = 2 * 4 * 36 * revenue_per_firm      # reps x deals/month x months
print(tam, sam, som)                     # 64800000 15552000.0 622080
Which method should you use?
Our view is that you'll nearly always want both in the end. Where to start depends on your situation:
- With a new product and little data, start top-down for a quick range, then build bottom-up as soon as you can count buyers.
- Facing investor or board scrutiny, lead with bottom-up, because each input can be inspected, and show top-down as a cross-check.
- For an established product, go bottom-up from your own sales data. Wall Street Prep says bottom-up is more appropriate for established, mature companies.
- Selling into several segments, size each one separately; see the market segmentation guide for how to define them.
How do you test the assumptions behind either method?
The shakiest inputs are usually price, the share of buyers who really need the product, and the win rate. Primary research can tighten them. A survey of target buyers can estimate how many would consider the product and at what price. PulseLake supports survey-based research, and our articles on avoiding sampling bias and Van Westendorp pricing research cover the method. It doesn't replace the sources behind either method.
For US business counts, the Census Bureau's County Business Patterns provides establishments with paid employees by industry and employment size, along with employment and payroll (US Census Bureau). That's a ready-made bottom-up input for US-based B2B products.
Frequently asked questions
Is top-down or bottom-up market sizing better?
Neither wins every time. Top-down is quicker and suits products with little data, while bottom-up is easier to defend. Use both and explain any gap between them.
What is the formula for TAM?
Bottom-up, it's potential customers x annual revenue per customer. Top-down, it's a reported market total x the share relevant to your product. Wall Street Prep writes it for SaaS as customers x ACV.
How do you calculate SAM from TAM?
You multiply TAM by the percentage you can serve, based on geography, segment and channels. In the hypothetical example above, that was 40% x 60% = 24% of firms.
How do you calculate SOM?
There are two routes. Apply an obtainable percentage to SAM, or derive it from capacity: deals your team can close in the period x revenue per customer. The capacity route makes you check the number against real sales resources.
What if my top-down and bottom-up numbers disagree?
Work out why before you pick one. Look for different segment definitions, a price that doesn't match average spend, and filters applied to the wrong base. A gap you can explain actually adds credibility.
Can I size a market without paid reports?
Yes, for a bottom-up estimate. Government statistics, your own customer lists and a spreadsheet are enough. Paid reports mostly speed up the top-down side.