Evidence Graph: Building Traceable Research Knowledge
Evidence graph design links raw research evidence to findings and decisions, making every conclusion easier to trace, verify, challenge, and reuse.

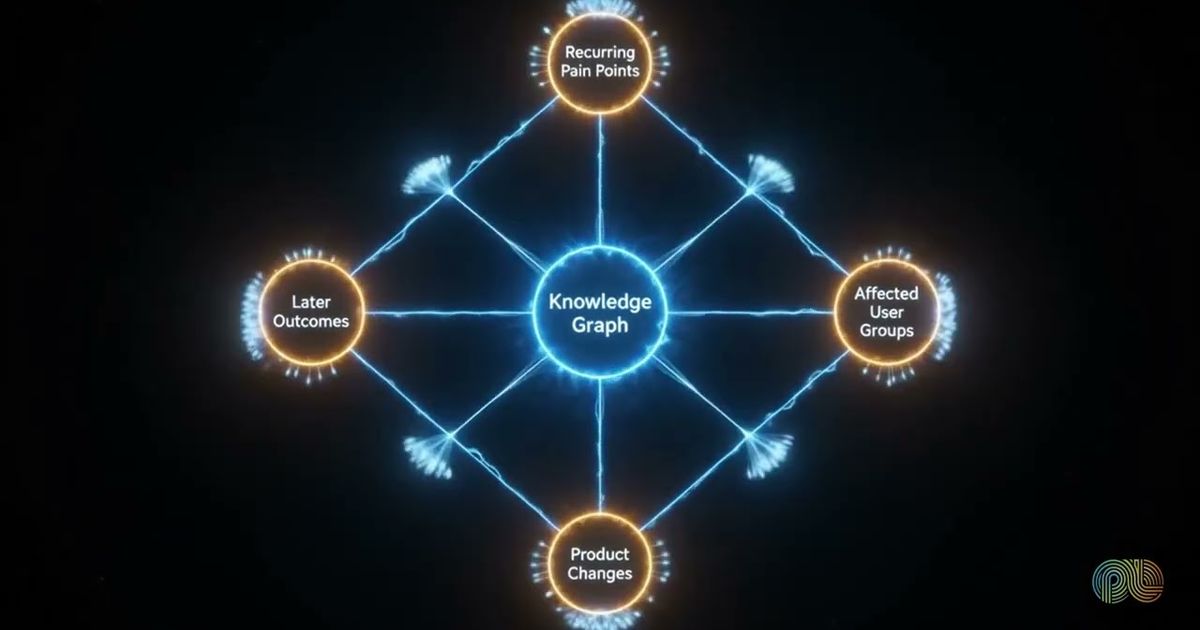
An evidence graph is a structured network linking raw research observations to themes, findings, insights, recommendations and decisions. Explicit relationships preserve the reasoning between each level, so anyone can trace a conclusion back to interview excerpts, survey responses, behavioral events, usability observations, documents or experimental results.
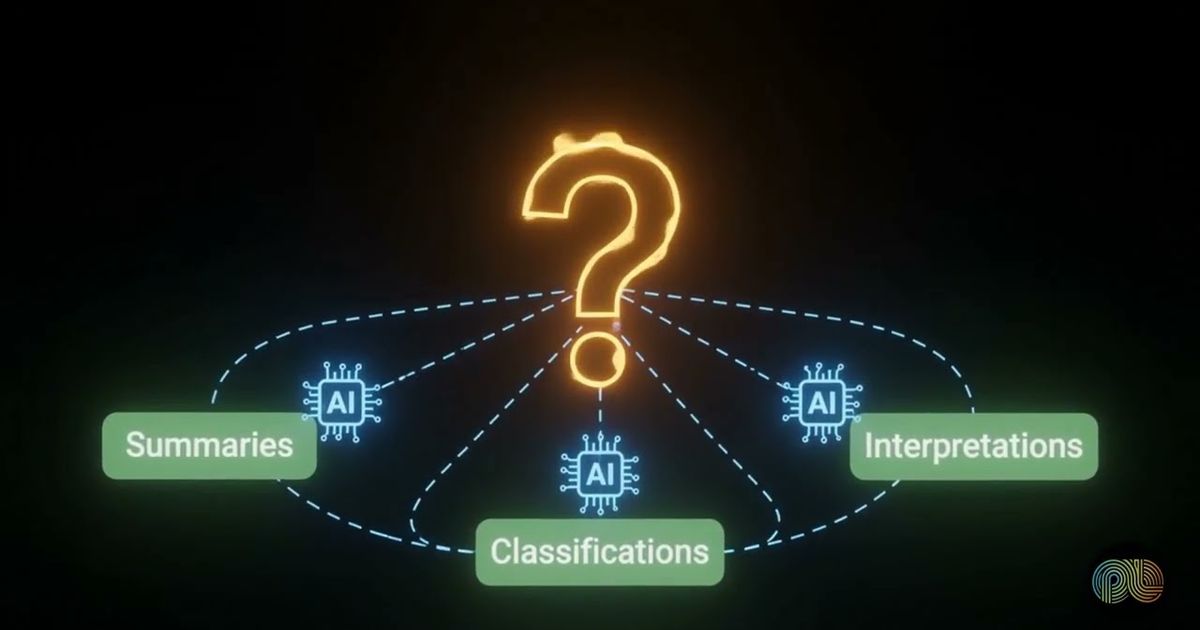
"Where did that come from?" It's the question that sinks most research recommendations.
When the support for a conclusion lives in someone's memory, or in a summary nobody checked, it's hard to trust. Our position is simple: a recommendation you can't trace isn't finished. An evidence graph makes research easier to validate, challenge, improve and reuse as the organization's knowledge grows.
What is an evidence graph?
It treats research as connected objects, with no loose files in the pile. Nodes hold observations and interpretations. Relationships say how one object supports, contradicts, refines or leads to another.
Start at the bottom. There you find raw or lightly interpreted observations: an interview excerpt, a survey response, a behavioral event, a usability observation, a document passage, an experimental result. Researchers link those upward through steadily higher levels of interpretation.
- Themes group related observations, without claiming a final conclusion.
- Evidence statements summarize what a defined set of observations indicates.
- Findings and insights say why the evidence matters for a research question.
- Recommendations and decisions name the action the findings support.
A link has to mean something. Saying two items are "related" isn't enough; the relationship records why one piece of information supports the next. That's what turns a research repository people can actually use into a traceable knowledge system.
How do you build an evidence graph?
Small, to begin with. Build up from the smallest useful units of evidence; a complete report is the wrong place to start. Find reusable research objects, give them consistent definitions and join them with explicit relationships.
Here's the order we'd follow:
- Define the objects. Decide what counts as an observation, question, theme, evidence statement, finding, recommendation and decision.
- Capture reusable evidence. Store excerpts, responses, events, results and observations as separate objects, each with its source context.
- Link them, and record why each link exists.
- Standardize. Consistent identifiers, metadata and semantic definitions are what let relationships hold up across studies.
How big should an object be? That takes judgment: small enough to reuse and trace, complete enough to keep its meaning. An interview excerpt needs enough surrounding context that it doesn't turn into a misleading fragment.
Governance matters more as the graph grows. Shared definitions stop one team's "finding" from being another team's "observation," and identifiers separate similar evidence gathered in different studies. Those foundations are what make it organizing research into reusable knowledge and not just another pile of disconnected outputs.

How does an evidence graph support AI research systems?
By giving AI something structured and traceable to stand on, so the system isn't inferring knowledge from isolated reports. Retrieval gets more precise, synthesis gets easier to verify, and generated answers are less likely to drift from what supports them.
Such a system can pull specific evidence objects and follow their relationships to relevant themes, findings or decisions. It can return the supporting chain with its answer, which lets a researcher check whether the retrieved evidence really backs the generated conclusion.
Structure doesn't replace human judgment, though. Researchers still review semantic definitions, assess evidence quality, resolve ambiguous connections and approve important interpretations. The graph just makes that oversight practical, because the reasoning path is exposed instead of buried in a generated summary.
And new studies plug into existing questions, themes and findings as they arrive. Over time you get a growing network where new research strengthens, qualifies or challenges what's known, with the reasoning behind important conclusions still attached.
Why is an evidence graph better than a traditional report?
A report compresses. A graph keeps the path.
Reports are still good at communicating. What readers usually can't do is inspect each reasoning step behind a recommendation. In a report-centered system the evidence gets summarized inside slides, paragraphs or appendices, so a reviewer who wants to know where a claim came from digs through documents, asks the original researcher or relies on memory. And once a report goes stale, the evidence and reasoning inside it are hard to update on their own.
Now flip it. In a graph-centered system, evidence, interpretations and decisions are kept separate but connected. A reviewer follows a recommendation to its findings, looks at the themes behind them, then drops down to the underlying observations. We think that transparency is the real payoff: conclusions are easier to validate, weak links easier to challenge, conflicting evidence easier to fold in, and interpretation easier to improve over time.
The two do different jobs. Reports tell a coherent story to one audience; evidence graphs keep the underlying knowledge and reasoning open to inspection and reuse.

How PulseLake helps
PulseLake keeps objectives, methodology, evidence and decisions in a persistent study context, supported by a research knowledge graph, cross-study search and evidence provenance. Specialized agents can help with interviewing, qualitative analysis, deep research and reporting while researchers keep judgment and approvals. To talk about how this approach could support your research system, talk to our team.
Frequently asked questions
What types of research data can an evidence graph connect?
Both qualitative and quantitative: interview excerpts, survey responses, behavioral events, usability observations, documents and experimental results. Those source objects can then link to research questions, themes, evidence statements, findings, insights, recommendations and decisions, provided each relationship keeps enough context to be understood and reviewed.
Does an evidence graph replace research reports?
No. A report is still the best way to tell a focused story to a particular audience, and the evidence graph keeps the reusable evidence and reasoning underneath it. Teams can produce reports from connected knowledge and still let reviewers trace claims back through findings and themes to the original observations.
How detailed should evidence graph nodes be?
Granular enough to trace and reuse, but not so fragmented that they lose meaning. A useful node usually represents one coherent observation, statement, theme, finding or decision. Keep source details, study context and metadata attached, so nobody reads an excerpt or result outside the conditions it was collected in.
Can an evidence graph represent conflicting evidence?
Yes, and it should. A good evidence graph keeps disagreement visible instead of forcing every observation into one conclusion. Separate relationships can show which evidence supports, contradicts, qualifies or applies only under certain conditions, so researchers can inspect the conflict, revise interpretations or flag questions that need more human research.