Research Knowledge Graphs: Connecting Evidence
Research knowledge graphs connect studies, evidence, findings, and decisions, making institutional knowledge easier to trace, retrieve, and reuse over time.
A research knowledge graph is a structured, evolving network that connects research questions, participants, observations, themes, findings, recommendations, products, business goals and decisions. It stores those objects and their relationships apart from any single report. That's why research knowledge graphs make evidence easier to discover, trace, compare and reuse across studies and over time.
Most organizations are good at keeping documents and bad at keeping the connections between them. That's where insight goes missing. A graph turns accumulated research into institutional knowledge that later analysis and decisions can use.
What is a research knowledge graph?
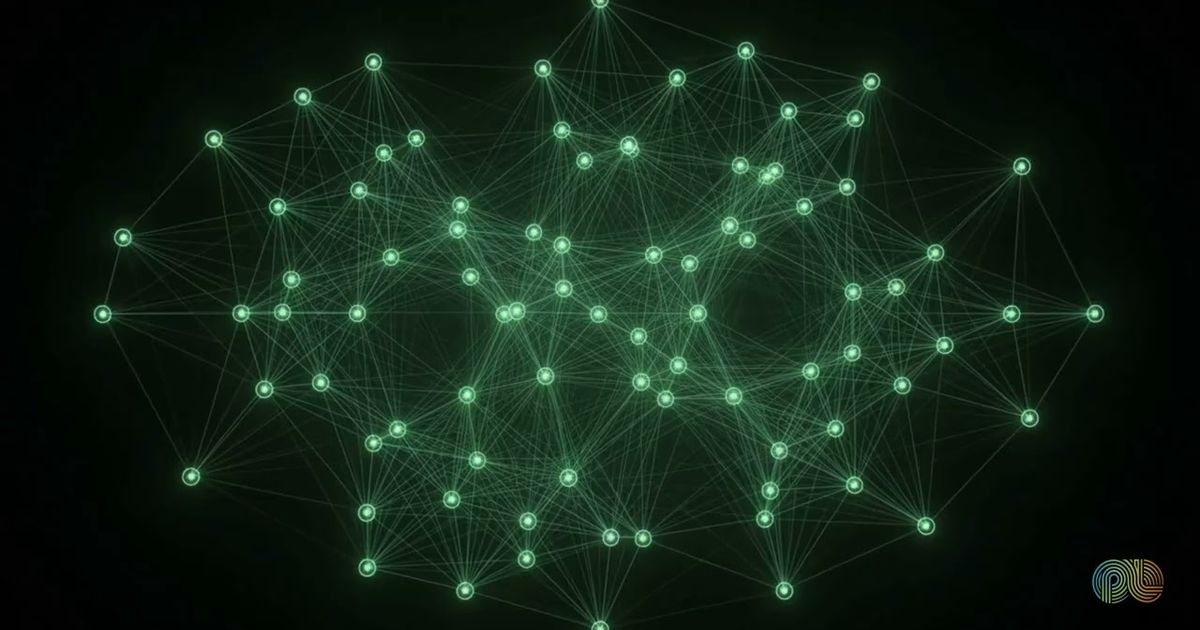
Think about the difference between a shelf and a web. A repository holds a stack of separate reports. A graph treats research as connected entities and relationships, so each meaningful object gets its own identity and can link to several studies, findings, decisions or business goals.
The objects range widely: research questions and hypotheses, participants and user groups, observations, coded responses and themes, findings, recommendations and decisions, and the products, features, journeys and business goals they touch.
Relationships say how these things support or affect each other. One finding could rest on several observations, apply to one user group, inform a recommendation and feed a product decision.
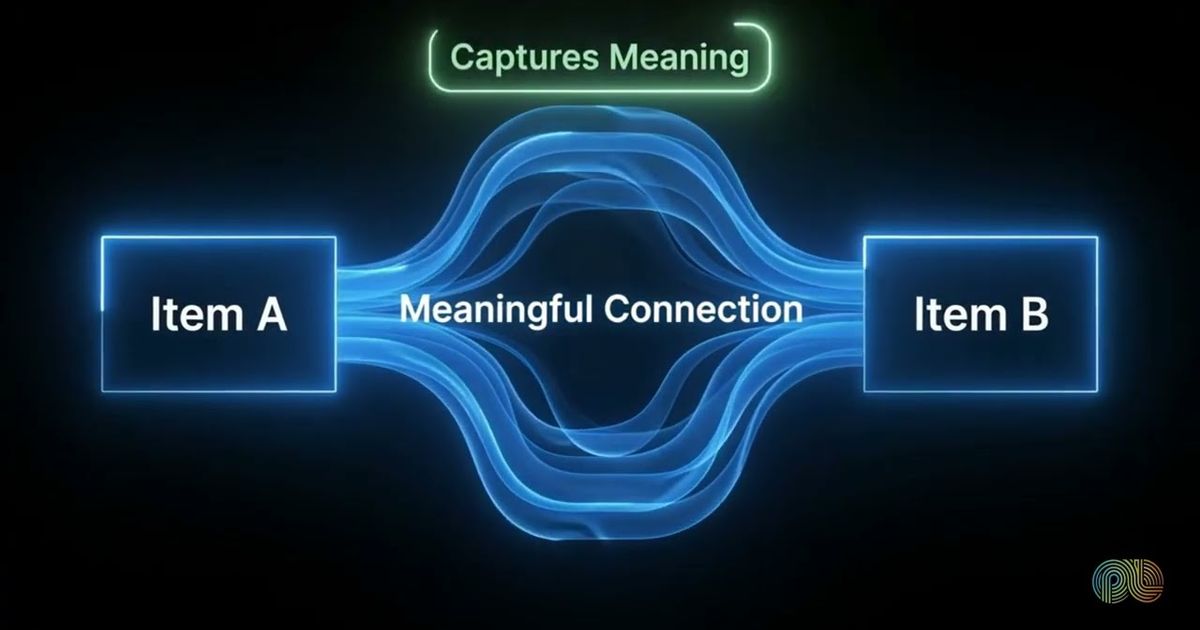
And no, it isn't a pretty map of links between reports. The value sits in what each connection means. Follow the path and you can walk from a decision back to the evidence behind it, whether you're a person or a system. It's the same idea as knowledge graphs in scientific research, pointed at customer and market studies.
How should teams build a research knowledge graph?
Small. Pick one defined research use case, a short consistent set of entities and relationships, and let the graph grow through ordinary research work.
We'd be wary of switching on automated linking and walking away, because provenance and verification have to come with every addition. What holds up in practice:
- Decide which questions, audiences, themes, findings, recommendations, products and goals deserve their own identities.
- Name relationships the same way every time ("supports," "contradicts," "applies to," "informed").
- Tie every finding and relationship to its original study or evidence source through clear evidence lineage.
- Have a researcher check uncertain or AI-suggested relationships before they become trusted organizational knowledge.
- Maintain it: merge duplicates, fix outdated links, keep the history as evidence develops.
A good graph grows with the organization. Each study adds to the network, each meaningful relationship makes something easier to find, and each verified connection gives the next analysis firmer footing.
How does a research knowledge graph connect studies over time?
Every new study attaches its evidence to topics, populations, findings and decisions that already exist, so it strengthens, challenges or refines what the organization knows. Nothing has to start life as a silo.
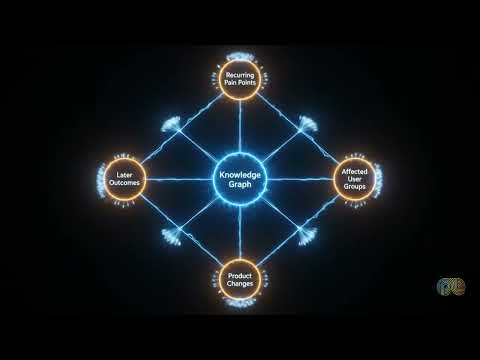
Hypothetically, a company has studied customer onboarding again and again over several years. With a graph, researchers follow the links between recurring pain points, affected user groups, product changes and later outcomes. Nobody reopens every old report to compare them by hand.
The loop is simple, and it accumulates. First, capture questions, observations, themes, findings and recommendations as distinct entities. Then link findings to their supporting evidence, relevant audiences, products and goals. When later evidence arrives, attach new observations to the existing entities rather than creating duplicate, isolated records. Finally, update the strength, scope or interpretation of connections as the evidence changes.
That's also what makes cross-study synthesis practical: researchers compare connected evidence and don't rebuild the relationships from documents every time.

Why do research knowledge graphs improve AI-assisted research?
Keyword search finds documents that contain a phrase. Fine, until the evidence you need uses other words or lives in a study only indirectly related.
A graph lets AI retrieve through semantic relationships as well as keywords, and it leaves a traceable path from a generated conclusion back to the studies, findings and observations behind it. Graph-guided retrieval follows known relationships among concepts, audiences, findings and decisions, so it picks up material that literal matching would miss.
That connected context helps an AI-assisted system find supporting evidence across multiple studies, and spot findings that conflict or only hold under certain conditions. It can synthesize related information without flattening important distinctions, and it keeps traceability from an answer to its underlying evidence.
The result is better-grounded synthesis. A conclusion is easier to inspect when its evidence path stays in view, which is the whole idea behind grounded AI responses.

How PulseLake helps
PulseLake maintains persistent study context and a research knowledge graph for cross-study search, deep research and natural-language questions with evidence provenance. Its execution, intelligence and delivery layers share that context, which helps teams connect research activity to reusable knowledge and decision-ready outputs. To discuss how this could support your research system, talk to our team.
Frequently asked questions
Can a research knowledge graph replace a research repository?
Usually it sits alongside one. The graph adds a structured relationship layer around what the repository stores: reports, transcripts, datasets and presentations stay as source artifacts, and the graph connects their questions, evidence, findings and decisions. Repository content gets easier to navigate and reuse, and the original documents stay put.
Which research objects should a team add to a knowledge graph first?
Whatever a specific decision or recurring research area needs, which might be research questions, studies, audience groups, observations, themes, findings, recommendations, products and business goals. A limited model is easier to keep consistent, so get the relationships right before you branch into other domains.
How can a knowledge graph represent conflicting research findings?
Keep the conflicting findings as separate entities and link each one to its supporting evidence, audience, study context and conditions. The graph shouldn't quietly merge disagreement into a single conclusion. Once those paths are visible, researchers and AI systems can explain why findings differ and check whether later evidence settles or narrows the conflict.