Knowledge Graphs for Research Explained
Knowledge graphs for research connect evidence, findings, themes, and decisions so teams and AI can discover context, trace sources, and reuse insights.

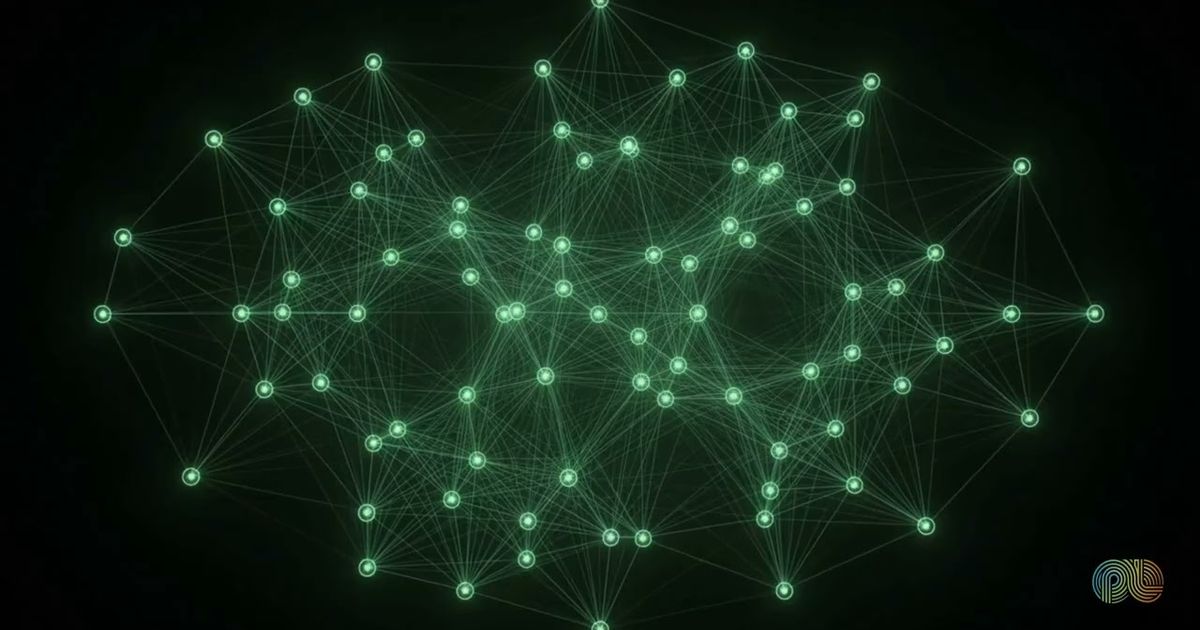
Knowledge graphs for research turn scattered reports, presentations, interview notes, and datasets into a connected network of entities and meaningful relationships. They link questions, participants, products, behaviors, themes, findings, assumptions, recommendations, and source evidence so researchers and AI systems can explore accumulated knowledge with context and traceability.
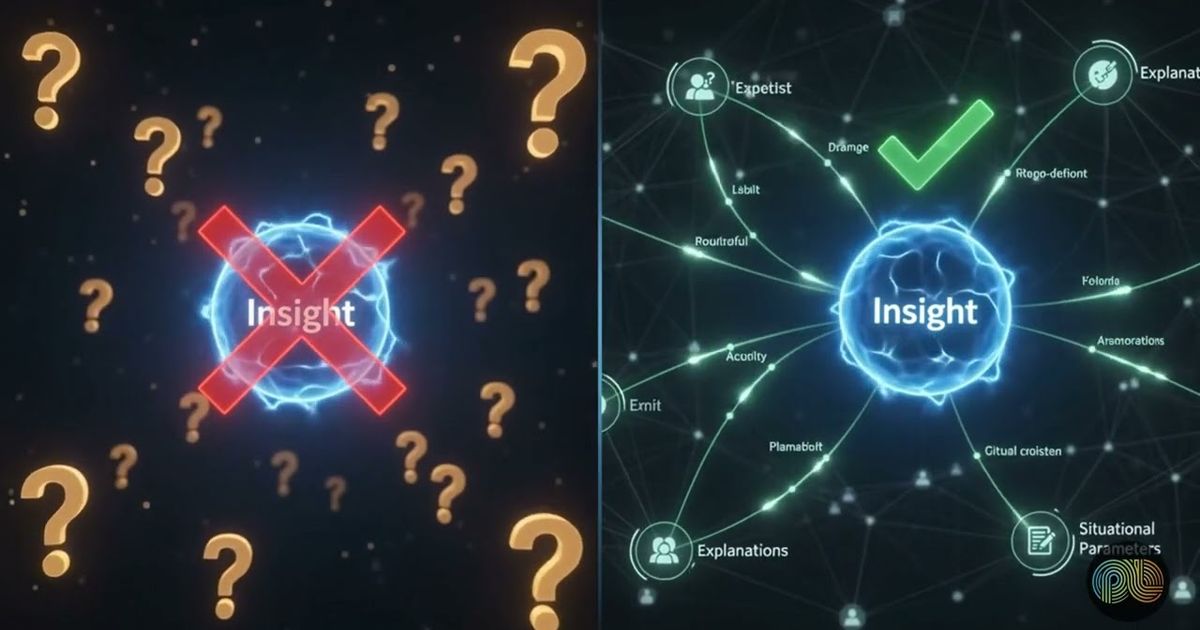
This matters because valuable evidence often remains isolated in files that never become part of the same organizational conversation. Connecting that evidence helps each new project build on previous learning rather than starting from scratch. The short video above shows how this connected structure works.
What is a knowledge graph in research?
A research knowledge graph represents information as entities connected through relationships that explain how those entities relate. It models knowledge as a living structure rather than treating every report as an independent document.
Entities can include research questions, participants, customer segments, products, features, behaviors, themes, findings, assumptions, and recommendations. Relationships add meaning by showing, for example, that an observation supports a finding, a finding concerns a feature, or a recommendation responds to a recurring behavior.
This structure reflects how research knowledge actually develops. Questions lead to evidence, evidence contributes to findings, findings may support or challenge assumptions, and recommendations connect those findings to decisions. Organizing these connections through a consistent research taxonomy makes the graph easier for both people and AI systems to navigate.

How does a knowledge graph connect scattered evidence?
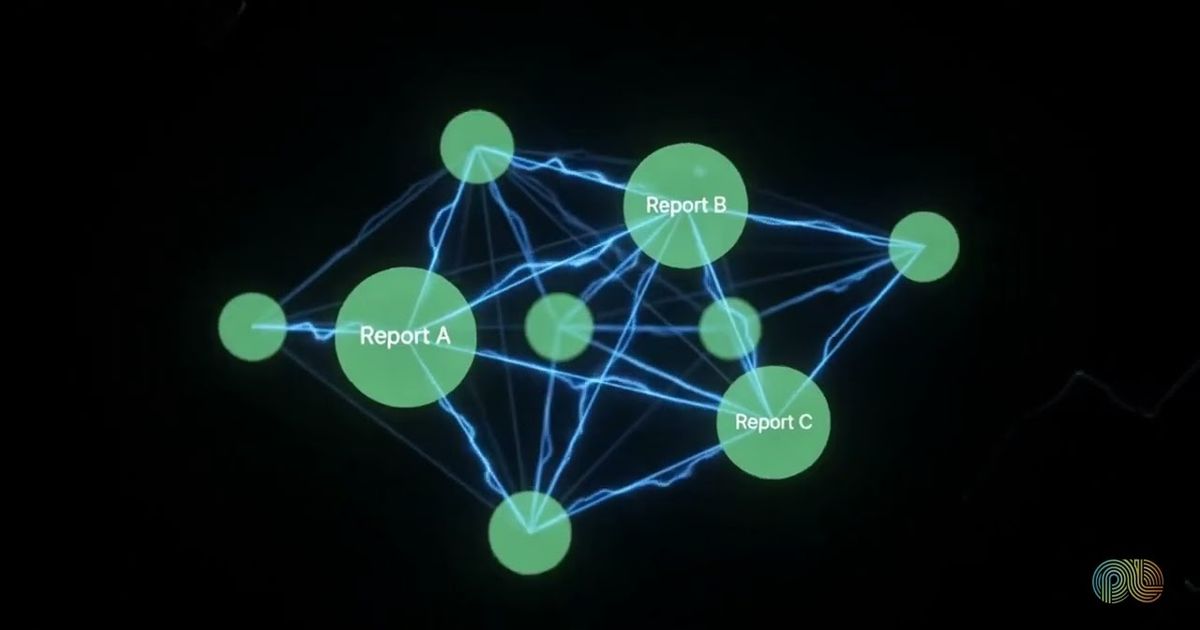
A knowledge graph connects related material across document and study boundaries. Researchers can start with the subject they care about and follow its relationships to relevant evidence instead of opening files one by one.
Imagine a team investigating why customers struggle with a feature. The feature could connect directly to observations from usability sessions, supporting quotes, affected customer segments, contradictory findings from another study, related behaviors, and previous design recommendations. Each connection gives the researcher a path through accumulated knowledge while retaining the source behind it.
The result is a map of organizational understanding rather than a library of disconnected files. Documents still matter as source material, but the graph makes their contents discoverable and reusable at a more precise level. This also supports cross-study knowledge linking, where related evidence can inform a new question without losing its original study context.
Why do knowledge graphs make research AI more effective?
Knowledge graphs give AI systems structured relationships to follow, improving retrieval, synthesis, and reasoning over research evidence. The AI can navigate semantic connections instead of relying only on matching words in documents.
Keyword search may miss relevant evidence when teams use different terms for the same concept or when the connection is implied rather than stated. A graph can connect a feature to a theme, the theme to a behavior, and the behavior to observations from several studies. That makes it possible to retrieve conceptually related evidence even when the underlying documents use different language.
Graphs also help preserve provenance when evidence is combined across studies. Sources, participants, methods, dates, and study contexts can remain attached to findings rather than disappearing inside a generated summary. Competing findings stay visibly connected, making contradictions easier to detect and investigate instead of allowing one conclusion to silently replace another.
How should a research knowledge graph evolve?
A research knowledge graph should grow as new evidence arrives while preserving what the organization previously knew. New studies can strengthen existing relationships, challenge earlier findings, or introduce new entities and connections.
A practical update process includes four steps:
- Add the source context. Preserve the study, method, audience, and original evidence.
- Identify meaningful entities. Capture the questions, topics, products, segments, findings, and decisions involved.
- Create explicit relationships. Show what supports, contradicts, affects, or informs something else.
- Review and refine. Resolve duplicates, maintain definitions, and retain competing interpretations when evidence is uncertain.
New evidence should not automatically overwrite old evidence. Conditions, customer groups, products, and research methods may differ, so apparently conflicting findings can both be valid within their original contexts. Over time, the graph becomes an evolving organizational memory that supports discovery, reasoning, traceability, and continuous learning.

Key takeaways
- Knowledge graphs connect research assets through meaningful relationships rather than leaving evidence inside isolated files.
- Researchers can move from a question, feature, or theme directly to related observations, quotes, findings, segments, and recommendations.
- AI systems can retrieve semantically related evidence while preserving source context and provenance.
- New research can strengthen, challenge, or extend existing knowledge without erasing earlier findings.
- A maintained graph helps every new project benefit from what the organization has already learned.
How PulseLake helps
PulseLake provides persistent study context and a research knowledge graph for connecting questions, evidence, findings, and decisions across projects. Cross-study search, deep research, and natural-language questions with evidence provenance help researchers explore accumulated knowledge, while governance and lineage preserve how outputs relate to their sources. To discuss how this could support your research system, talk to our team.
Frequently asked questions
Is a research knowledge graph the same as a research repository?
No. A repository primarily stores and organizes research documents, recordings, datasets, and other assets. A knowledge graph represents the entities inside and across those assets, then connects them through meaningful relationships. The two can work together: the repository preserves source material, while the graph helps people explore what that material collectively says.
What types of research evidence belong in a knowledge graph?
A research knowledge graph can include qualitative observations, participant quotes, survey findings, behavioral evidence, themes, assumptions, recommendations, and decisions. It can also represent contextual entities such as products, features, customer segments, research questions, and studies. The important requirement is that each item retains a clear relationship to its original evidence and context.
How does a knowledge graph preserve research provenance?
A knowledge graph can connect each claim or finding to the study, method, participant group, observation, dataset, or quote that supports it. Those links allow researchers and AI systems to trace a conclusion back to its source. Provenance remains especially important when combining evidence from multiple studies because methods, populations, and conditions may differ.
Do knowledge graphs eliminate contradictory research findings?
No. Knowledge graphs make contradictions visible rather than resolving them automatically. Competing findings can remain connected to the same topic along with their sources, methods, audiences, and conditions. Researchers can then determine whether the difference reflects changing behavior, distinct customer segments, methodological differences, incomplete evidence, or a question that requires further study.